
We are pleased to announce a new release of Lightbend Telemetry, a suite of observability tooling for Lightbend Platform. This release includes new instrumentation providing key visibility into Akka’s Persistent Actors and Lagom’s Persistent Entities.
Lightbend Telemetry provides views into the inner-workings of distributed applications built with Akka, Lagom, Play, Java, and Scala. This lets Lightbend customers tap into the “black box” of distributed systems via events, metrics and distributed tracing. In addition to Lightbend Console, integrations are provided for visualization and monitoring tools like Grafana, Jaeger, New Relic, Datadog, and others.
Akka persistence enables actors to persist their state so that it can be recovered after it is either restarted or migrated within a cluster. They are often used to implement the pattern of event sourcing. A persistent actor will receive commands, which may generate events representing the effect of the command. These events are persisted first, then used to change the actor’s state. In the event of a restart, the events can be replayed to restore the actor’s state.
Lagom provides a guided framework that encodes many best practices for implementing event sourcing and CQRS. Persistent Entities represent the write-side of the framework, and are implemented using Persistent Actors.
Telemetry 2.12 introduces new instrumentation for Akka’s Persistent Actors and Lagom Persistent Entities, including:
This is in addition to existing instrumentation covering the recovery of a persistent actor.
As always, Telemetry includes pre-built Grafana dashboards for these new metrics for Prometheus, Elasticsearch, and Graphite. The Prometheus dashboards come pre-installed with Lightbend Console.
These dashboards are organized by entity type (Akka PersistentActor class or Lagom PersistentEntity class):

The graphs themselves display metrics per command and event type:

An “All in one” graph provides a view of where time is spent in the course of processing all commands.

Stash, processing and persistence times are common places where significant time can be lost. Again, these graphs display metrics per command or event type.

This instrumentation may also be used with Telemetry’s existing OpenTracing integrations to provide an end-to-end perspective that includes persistent actors.
The following trace displays the time for a “gameentity” to handle a command, and persist the related event. We can see that the bulk of the request is spent persisting the event:

In the next case, there are two entities interacting - “gameroomentity” and “gameentity”. While “gameroomentity” handles the command as above, “gameentity” is not active (in memory). Thus, when the command is received, extra time is taken to recover the entity’s state from persistent storage. While this recovery takes place, the command is sitting in the actor’s internal stash waiting to be processed. Finally, the command is processed and the event persisted.

In the final example, though both entities are active, they also both contain stash spans. This will occur when both entities are in the process of persisting a previous event.

Lightbend Telemetry offers distributed tracing via the OpenTracing standard and includes out of the box modules for Zipkin, Jaeger and Datadog. The above screenshots are from Zipkin.
In the near future, we will add support for Lagom Read Side Processors, to provide a full view of a Lagom application implementing Event Sourcing and CQRS.
When running services containing high throughput Akka streams, every cycle matters for performance. While Telemetry aims to minimize its impact, some performance hit is inevitable, particularly for Akka streams stages that perform relatively little processing (e.g. a quick .map() operation). This can start to add up in a very high throughput application.
To minimize this performance impact, Telemetry now offers the ability to only report a sampling of Akka Streams elements moving through the stream.
This sampling can be configured on the basis of:
For more information on the use cases for Lightbend Telemetry’s Akka Streams instrumentation, see the documentation.
The performance and distribution of actor mailbox and stash metrics for aggregated actors (reported by actor class or group) has been improved with the introduction of sampling. This means that each actor’s mailbox and stash size will only be recorded every 1 second by default.
Without sampling, each actor’s mailbox and stash size is reported every time it changes. For metrics aggregated by actor class or group, this meant that a small number of actors with frequently changing mailbox or stash sizes could skew the entire distribution, as their mailboxes and stash sizes would be represented much more than less active actors.
This also results in a performance improvement, as the overhead of instrumenting the actor is further reduced. Note that the sampling period is configurable.
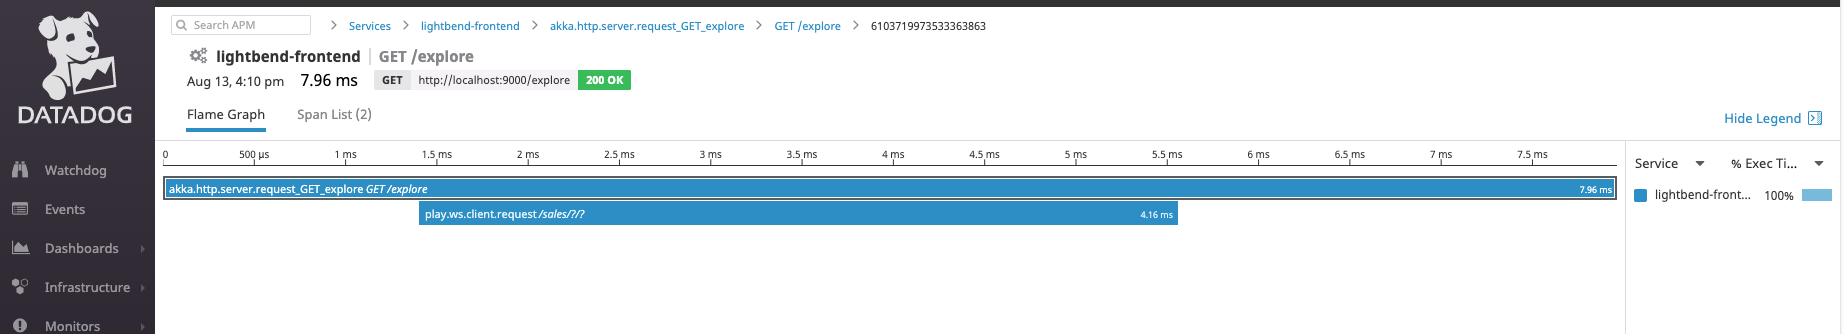
Lightbend Telemetry 2.12 adds an OpenTracing module for Datadog, enabling Lightbend Platform users to quickly and easily integrate with Datadog’s distributed tracing.
Distributed tracing provides an end to end view of your system from the point of view of user requests, helping to answer the question “Where is my system slow?” Lightbend Telemetry provides configuration-based tracing for Play, Akka, Lagom and Pipelines applications, so you can quickly get started with distributed tracing without having to make significant code changes.
In addition to Datadog, Lightbend Telemetry can integrate with any OpenTracing-compatible tracers, such as Jaeger and Zipkin.
As always, we’re interested in any feedback or ideas for Lightbend Telemetry, to improve the visibility into reactive applications and distributed systems. Reach out to us through Lightbend Support or contact us.

